Introduction
I have changed the hostfile that determines the order of OpenMPI execution nodes and re-measured OpenMPI performance on the Himeno benchmark as this article I posted it. After posting, I thought about it again and decided to use objective figures instead of my own judgments based on CPU and clock performance.
So this time, I decided to measure the performance of each individual workstation (node), and then decide the order of hostfile according to the results, and measure them again.
Performance measurements for each workstation
For the performance measurement, it was decided to use a calculation size of L for C and static allocate version in order to align the conditions with the MPI version.
The results were as follows. The results of this measurement were added to the list of workstations in this post.
| jupiter | ganymede | saisei | mokusei | europe | |
|---|---|---|---|---|---|
| CPU | Xeon(R) CPU E5-1620 @ 3.60GHz | Xeon(R) CPU E5-2620 @ 2.00GHz | Xeon(R) CPU E5-2643 @ 3.30GHz | Xeon(R) CPU E5-2609 @ 2.40GHz | eon(R) CPU E3-1270 v5 @ 3.60GHz |
| # of CPU | 1 | 1 | 1 | 2 | 1 |
| # of core | 4 | 6 | 4 | 4 | 4 |
| MFLOPS | 4,775 | 3,312 | 4,616 | 3,109 | 5,438 |
hostfile
From the above results, hostfile was changed as follows.
# cat myhosts
europe slots=4
jupiter slots=4
saisei slots=4
ganymede slots=6
mokusei slots=8
Measurement Results
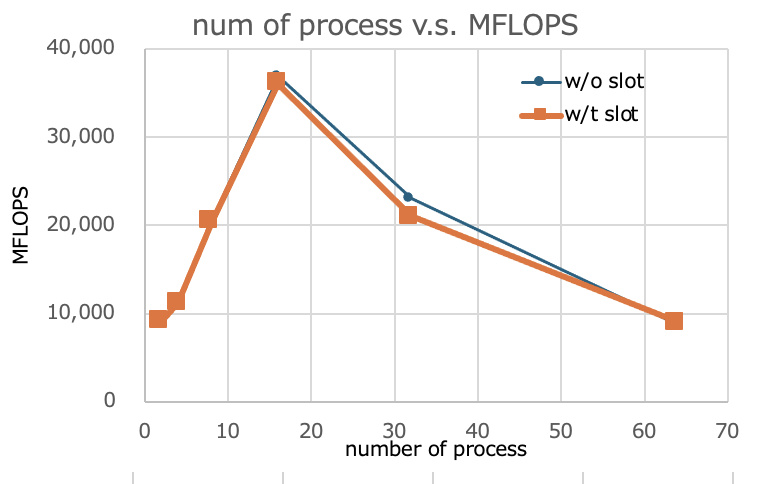
The number of boot processes and MFLOPS values without/with slots were as follows.
| np | MFLOPS(without slot) | MFLOPS(with slot) |
|---|---|---|
| 2 | 9,186 | 9,179 |
| 4 | 11,294 | 11,260 |
| 8 | 20,411 | 20,433 |
| 16 | 36,907 | 36,056 |
| 32 | 23,041 | 21,068 |
| 64 | 8,734 | 9,040 |
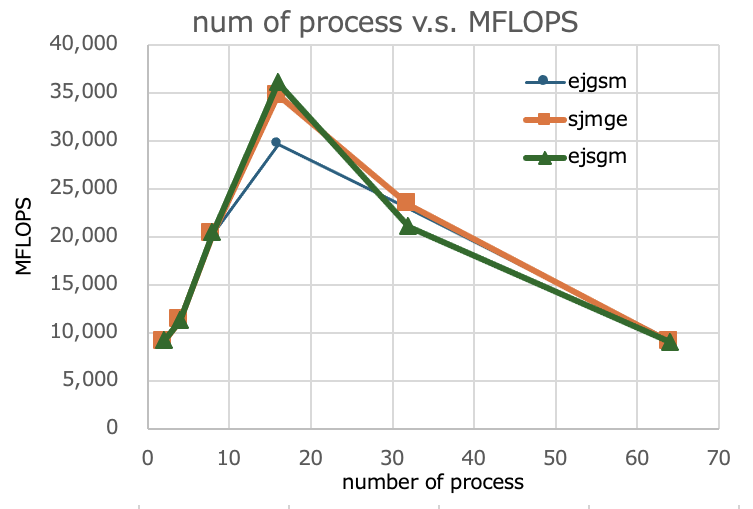
So far, the graphs of the results of the three measurements are as follows. The name of this time’s results shall be ejsgm.
Summary
Compared to the last time (results of the March 17 article), I have determined that the current results have not changed overall, although the numbers are a few percent better at 16 processes.
I don’t even know if I was incorrect for some reason about the results measured at 16 processes in the first (February 23 article).
Re-measurement for verification (additional details at a later date)
In the above, I suspected that the measurement results for 16 processes in this article were not being measured correctly, so I measured them again. I decided to try it.
First, I changed the hostfile as follows.
# cat myhosts
europe slots=4
jupiter slots=4
ganymede slots=6
saisei slots=4
mokusei slots=8
After that, we varied np from 2 to 64 and recorded the output MFLOPS. The results are as follows, and the values for February 23 are also listed for reference.
| np | MFLOPS(Feb. 23rd article) | MFLOPS(currently measured) | prev/curr comparison |
|---|---|---|---|
| 2 | 9,171 | 9,170 | 1.000 |
| 4 | 11,234 | 11,200 | 1.000 |
| 8 | 20,413 | 20,437 | 0.999 |
| 16 | 29,589 | 29,660 | 0.998 |
| 32 | 23,018 | 23,179 | 0.993 |
| 64 | 9,216 | 8,290 | 1.112 |
As mentioned above, there is some variation in the measured values when using 64 processes, but when using 2 to 32 processes, they match very well. Therefore, I judge that the data in the article posted on February 23rd is reliable.