Introduction
I recently posted what was obtained by PINNs for steady-state laminar flow. This time, I applied the PINNs method to unsteady laminar flows. The results of this time are not correct and different from the results of the referenced paper. I am investigating the cause, but I do not know.
Sources
- PINN-laminar-flows/PINN_unsteady - Unsteady version of github, which I introduced in my last post as source 1. I compared my results with data from Physics-informed deep learning for incompressible laminar flows, which can also be found on Github, and examined the validity of my results.
Physical background
Governing Equations
The governing equations in the recently posted PINNs - Steady-state Laminar Flow, namely the continuity and NS equations. Since the fluid is a two-dimensional incompressible fluid without external pressure, the equations (3) and (4) are as follows (The equations are numbered the same as before.)
$$ \nabla \cdot \boldsymbol{v} = 0 \tag{3} $$
$$ \rho \left(\frac{\partial \boldsymbol{v}}{\partial t} + (\boldsymbol{v}\cdot \nabla)\boldsymbol{v} \right) +\nabla p - \mu \Delta \boldsymbol{v} = 0\tag{4} $$
Expressing equations (3) and (4) using the two-dimensional coordinates $(x, y)$ and the velocity component $(u,v)$, we obtain $$ \frac{\partial u}{\partial x} + \frac{\partial v}{\partial y} = 0 \tag{5} $$
$$ \frac{\partial p}{\partial x} - \mu \left(\frac{\partial^2 u}{\partial x^2}+\frac{\partial^2 u}{\partial y^2}\right) + \rho \left( \frac{\partial u}{\partial t} + u\frac{\partial u}{\partial x}+v\frac{\partial u}{\partial y}\right) = 0 \tag{6} $$
$$ \frac{\partial p}{\partial y} - \mu \left(\frac{\partial^2 v}{\partial x^2}+\frac{\partial^2 v}{\partial y^2}\right) + \rho \left( \frac{\partial v}{\partial t}+u\frac{\partial v}{\partial x}+v\frac{\partial v}{\partial y}\right) = 0 \tag{7} $$
In other words, the above equations are the governing equations for this time. In coding, the above are denoted as f1, f2, and f3, respectively.
Code
import package
import os
import numpy as np

import torch
import torch.nn as nn
import torch.nn.functional as F
from torch import optim
from torch.optim import lr_scheduler

import matplotlib.pyplot as plt

from pyDOE import lhs  # Latin Hypercube Sampling (LHS)

# run on cuda if possible
device = 'cuda' if torch.cuda.is_available() else 'cpu'
print("Running on", device)
Define a function
# Remove points inside the cylinder from collocation points
#  Find the distance between the center of the cylinder (xc, yc) and a point,
#  and delete anything less than the cylinder radius (r).
def Remove_inCylinder(coor, xc, yc, r):
    distance = np.array([((xy[0] - xc)**2 + (xy[1]-yc)**2)**0.5 for xy in coor])
    return coor[distance > r, :]
Define problem domain (variables, constants)
# Define variables to represent computation domains

# Some constants
IC_samples = 10000  # 4000→10000
wall_samples = 6000  # y=0,0.41 are meaningless, so increase the number of samples
cylinder_samples = 4000
inlet_samples = 6000  # x=0 is meaningless, so increase the number of samples
outlet_samples = 3000

# Domain bounds
xmin = 0.0
ymin = 0.0
tmin = 0.0
xmax = 1.1
ymax = 0.41
tmax = 0.5
lb = np.array([xmin, ymin, tmin])
ub = np.array([xmax, ymax, tmax])

# Inital Condition:
#  (u, v, p) = (0, 0, 0) at t= 0, x ∈ [0, 1.1], y ∈ [0, 0.41]

xy_IC = [0.0, 0.0] + [1.1, 0.41] * lhs(2, IC_samples)
t_IC = np.zeros((IC_samples, 1))
IC = np.concatenate((xy_IC, t_IC), 1)
IC = Remove_inCylinder(IC, xc=0.2, yc=0.2, r=0.05)

# define floor, ceiling
#   celling(x,y,t): (0, 0.41 ,0)-(1.1, 0.41, 0.5)
#   floor(x,y,t): (0, 0, 0)-(1.1, 0, 0.5)
CEILING = [0.0, 0.41, 0.0] + [1.1, 0.0, 0.5] * lhs(3, wall_samples)
FLOOR = [0.0, 0.0, 0.0] + [1.1, 0.0, 0.5] * lhs(3, wall_samples)

# Define cylinder surface
rt_CYLD = [0.0, 0.0] + [2*np.pi, 0.5] * lhs(2, cylinder_samples)
x_CYLD = np.multiply(0.05, np.cos(rt_CYLD[:, 0:1])) + 0.2
y_CYLD = np.multiply(0.05, np.sin(rt_CYLD[:, 0:1])) + 0.2
HOLE = np.concatenate((x_CYLD, y_CYLD, rt_CYLD[:, 1:2]), 1)

# define wall(floor, ceiling, hole)
WALL = np.concatenate((HOLE, CEILING, FLOOR), 0)

# Define INLET
U_max = 0.5
T = 0.5*2

xyt_INLET = [0.0, 0.0, 0.0] + [0.0, 0.41, 0.5] * lhs(3, inlet_samples)
x_INLET = xyt_INLET[:, 0:1]
y_INLET = xyt_INLET[:, 1:2]
t_INLET = xyt_INLET[:, 2:3]
u_INLET = 4 * (np.sin(2*np.pi*t_INLET/T + 3*np.pi/2)+1.0) * U_max * y_INLET*(0.41-y_INLET)/(0.41**2)
v_INLET = np.zeros_like(u_INLET)
INLET = np.concatenate((x_INLET, y_INLET, t_INLET, u_INLET, v_INLET), 1)

# Define OUTLET
OUTLET = [1.1, 0.0, 0.0] + [0.0, 0.41, 0.5] * lhs(3, outlet_samples)

# Define Collocation points, with refinement near the wall
collo_samples = 60000
refine_samples = 10000
near_samples = 2000

xyt_Collo = lb + (ub - lb) * lhs(3, collo_samples)
xyt_refine = [0.0, 0.0, 0.0] + [0.4, 0.4, tmax] * lhs(3, refine_samples)
xyt_floor = [0.0, 0.0, 0.0] + [1.1, 0.02, tmax] * lhs(3, near_samples)
xyt_ceiling = [0.0, 0.39, 0.0] + [1.1, 0.02, tmax] * lhs(3, near_samples)
Collo = np.concatenate((xyt_Collo, xyt_refine, xyt_floor, xyt_ceiling), 0)
Collo = Remove_inCylinder(Collo, xc=0.2, yc=0.2, r=0.05)
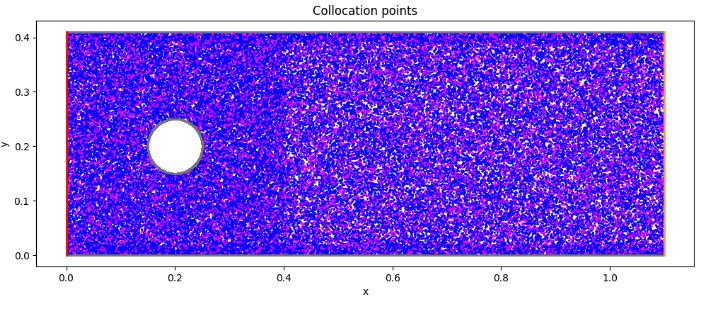
Visualize collocation point
# Visualize the collocation points
fig, ax = plt.subplots(figsize=(12,8))
ax.set_aspect('equal')
ax.scatter(Collo[:, 0:1], Collo[:, 1:2], marker='o', color='blue', s=1)
ax.scatter(IC[:, 0:1], IC[:, 1:2], marker='o', color='magenta', s=1)
ax.scatter(WALL[:, 0:1], WALL[:, 1:2], marker='o', color= 'gray', s=1)
ax.scatter(OUTLET[:, 0:1], OUTLET[:, 1:2], marker='o', color='orange', s=1)
ax.scatter(INLET[:, 0:1], INLET[:, 1:2], marker='o', color='red', s=1)
ax.set_title('Collocation points')
ax.set_xlabel('x')
ax.set_ylabel('y')
plt.show()
Tensorize variables used for training
# Define collocation, INLET, OUTLET, and WALL variables as torch.tensor
x_c = torch.tensor(Collo[:, 0:1], device=device, dtype=torch.float32)
y_c = torch.tensor(Collo[:, 1:2], device=device, dtype=torch.float32)
t_c = torch.tensor(Collo[:, 2:3], device=device, dtype=torch.float32)

x_IC = torch.tensor(IC[:, 0:1], device=device, dtype=torch.float32)
y_IC = torch.tensor(IC[:, 1:2], device=device, dtype=torch.float32)
t_IC = torch.tensor(IC[:, 2:3], device=device, dtype=torch.float32)

x_INLET = torch.tensor(INLET[:, 0:1], device=device, dtype=torch.float32)
y_INLET = torch.tensor(INLET[:, 1:2], device=device, dtype=torch.float32)
t_INLET = torch.tensor(INLET[:, 2:3], device=device, dtype=torch.float32)
u_INLET = torch.tensor(INLET[:, 3:4], device=device, dtype=torch.float32)
v_INLET = torch.tensor(INLET[:, 4:5], device=device, dtype=torch.float32)

x_OUTLET = torch.tensor(OUTLET[:, 0:1], device=device, dtype=torch.float32)
y_OUTLET = torch.tensor(OUTLET[:, 1:2], device=device, dtype=torch.float32)
t_OUTLET = torch.tensor(OUTLET[:, 2:3], device=device, dtype=torch.float32)


x_WALL = torch.tensor(WALL[:, 0:1], device=device, dtype=torch.float32)
y_WALL = torch.tensor(WALL[:, 1:2], device=device, dtype=torch.float32)
t_WALL = torch.tensor(WALL[:, 2:3], device=device, dtype=torch.float32)

mu = 0.005
rho = 1.0
Create a fully-connected layer network class
# define p_NN class

class p_NN(nn.Module):
    def __init__(self, n_input, n_output, n_hiddens=[32,64,128,128,64,32]):
        super().__init__()
        self.activation = nn.Tanh()
        self.input_layer = nn.Linear(n_input, n_hiddens[0])
        self.hidden_layers = nn.ModuleList(
            [nn.Linear(n_hiddens[i], n_hiddens[i+1]) for i in range(len(n_hiddens)-1)]
        )
        self.output_layer = nn.Linear(n_hiddens[-1], n_output)

    def forward(self, x):
        x = self.activation(self.input_layer(x))
        for layer in self.hidden_layers:
            x = self.activation(layer(x))
        x = self.output_layer(x)
        return x

    def neural_net(self, x, y, t):
        inputs = torch.cat([x, y, t], dim=1)
        outputs = self.forward(inputs)
        u = outputs[:, 0:1]
        v = outputs[:, 1:2]
        p = outputs[:, 2:3]
        return u, v, p

    def net_f(self, x, y, t):
        x.requires_grad = True
        y.requires_grad = True
        t.requires_grad = True
        u, v, p = self.neural_net(x, y, t)
        u_x = gradients(u, x)
        v_y = gradients(v, y)
        f1 = u_x + v_y

        p_x = gradients(p, x)
        u_y = gradients(u, y)
        u_t = gradients(u, t)
        u_xx = gradients(u_x, x)
        u_yy = gradients(u_y, y)
        f2 = p_x - mu*(u_xx + u_yy) + rho*(u_t + u*u_x + v*u_y)

        p_y = gradients(p, y)
        v_x = gradients(v, x)
        v_t = gradients(v, t)
        v_xx = gradients(v_x, x)
        v_yy = gradients(v_y, y)
        f3 = p_y - mu*(v_xx + v_yy) + rho*(v_t + u*v_x + v*v_y)

        return f1, f2, f3

    def predict(self, x, y, t):  # no tensor is passed, return no tensor
      xx = torch.tensor(x, device=device, dtype=torch.float32)
        yy = torch.tensor(y, device=device, dtype=torch.float32)
        tt = torch.tensor(t, device=device, dtype=torch.float32)
        uu, vv, pp = self.neural_net(xx, yy, tt)
        u = uu.to("cpu").detach().numpy()
        v = vv.to("cpu").detach().numpy()
        p = pp.to("cpu").detach().numpy()

        return u, v, p
Define differential function
# Differentiation by pytorch
# return dy/dx
def gradients(y, x):
    return torch.autograd.grad(y,
                               x,
                               grad_outputs=torch.ones_like(y),
                               create_graph=True,
                              )[0]
Create (instantiate) a model
# Create a Model
#  Input: (x, y)
#  Output: (u, v, p)
model = p_NN(3, 3).to(device)
print(model)
Define loss function and optimizer function
# Loss function: Mean Square Error
loss_func = nn.MSELoss()

# Optimizer: Adam(Adaptive moment estimation)
optimizer = optim.Adam(model.parameters(), lr=0.001)

# scheduler = lr_scheduler.ExponentialLR(optimizer, gamma=0.98)
As before, loss_func() is not used.
Learning loop
# learning Loop

num_epoch = 5000  # epoch count

Epoch = []
Loss_f1 = []
Loss_f2 = []
Loss_f3 = []
Loss_PINN = []
Loss_TOTAL = []
Loss_IC = []
Loss_WALL = []
Loss_INLET = []
Loss_OUTLET = []

for i in range(num_epoch):
    if i == 0:
        print("Epoch \t Loss_Total \t Loss_PINN \t Loss_IC \t Loss_WALL \t Loss_INLET \t Loss_OUTLET")

    optimizer.zero_grad()
    f1, f2, f3 = model.net_f(x_c, y_c, t_c)
    loss_f1 = torch.mean(f1**2)
    loss_f2 = torch.mean(f2**2)
    loss_f3 = torch.mean(f3**2)
    loss_PINN = loss_f1 + loss_f2 + loss_f3

    u_ic, v_ic, p_ic = model.neural_net(x_IC, y_IC, t_IC)
    loss_IC = torch.mean(u_ic**2) + torch.mean(v_ic**2) + torch.mean(p_ic**2)

    u_wall, v_wall, _ = model.neural_net(x_WALL, y_WALL, t_WALL)
    loss_WALL = torch.mean(u_wall**2) + torch.mean(v_wall**2)

    u_inlet, v_inlet, _ = model.neural_net(x_INLET, y_INLET, t_INLET)
    loss_INLET = torch.mean((u_inlet - u_INLET)**2) + torch.mean(v_inlet**2)

    _, _, p_outlet = model.neural_net(x_OUTLET, y_OUTLET, t_OUTLET)
    loss_OUTLET = torch.mean(p_outlet**2)

    loss_TOTAL = loss_PINN + 2*(loss_IC + loss_WALL + loss_INLET + loss_OUTLET)

    loss_TOTAL.backward()
    optimizer.step()

    if i % 100 == 0:
        Epoch.append(i)
        Loss_f1.append(loss_f1.detach().cpu().numpy())
        Loss_f2.append(loss_f2.detach().cpu().numpy())
        Loss_f3.append(loss_f3.detach().cpu().numpy())
        Loss_PINN.append(loss_PINN.detach().cpu().numpy())
        Loss_TOTAL.append(loss_TOTAL.detach().cpu().numpy())
        Loss_IC.append(loss_IC.detach().cpu().numpy())
        Loss_WALL.append(loss_WALL.detach().cpu().numpy())
        Loss_INLET.append(loss_INLET.detach().cpu().numpy())
        Loss_OUTLET.append(loss_OUTLET.detach().cpu().numpy())

    if i % 1000 == 0:
        print(i, "\t",
              format(loss_TOTAL.detach().cpu().numpy(), ".4E"), "\t",
              format(loss_PINN.detach().cpu().numpy(), ".4E"), "\t",
              format(loss_IC.detach().cpu().numpy(), ".4E"), "\t",
              format(loss_WALL.detach().cpu().numpy(), ".4E"), "\t",
              format(loss_INLET.detach().cpu().numpy(), ".4E"), "\t",
              format(loss_OUTLET.detach().cpu().numpy(), ".4E"), "\t",
             )
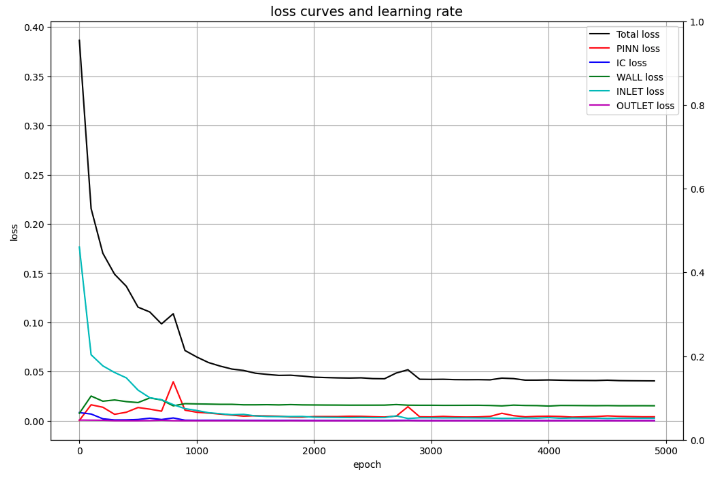
Visualize losses
# Draw loss curves

fig, ax1 = plt.subplots(figsize=(12, 8))
ax2 = ax1.twinx()

ax1.plot(Epoch, Loss_TOTAL, c='black', label='Total loss')
ax1.plot(Epoch, Loss_PINN, c='red', label='PINN loss')
ax1.plot(Epoch, Loss_IC, c='b', label='IC loss')
ax1.plot(Epoch, Loss_WALL, c='g', label='WALL loss')
ax1.plot(Epoch, Loss_INLET, c='c', label='INLET loss')
ax1.plot(Epoch, Loss_OUTLET, c='m', label='OUTLET loss')
ax1.set_xlabel('epoch')
ax1.set_ylabel('loss')
ax1.set_title('loss curves and learning rate', fontsize='14')
ax1.grid()
ax1.legend()

plt.show()
Visualization of the time evolution of pressure at a specific point
To check if the same results as in the paper were obtained, visualize the time trends for the three pressures listed in the paper.
# Predict the time evolution of pressure
# at the pressure measurement point (virtual pressure probe)
t_probe = np.linspace(0, 0.5, 100)
x1 = np.zeros_like(t_probe)
x2 = np.zeros_like(t_probe)
x3 = np.zeros_like(t_probe)
x1.fill(0.15)
x2.fill(0.20)
x3.fill(0.25)
y1 = np.zeros_like(t_probe)
y2 = np.zeros_like(t_probe)
y3 = np.zeros_like(t_probe)
y1.fill(0.20)
y2.fill(0.25)
y3.fill(0.20)
x1 = x1.flatten()[:, None]
x2 = x2.flatten()[:, None]
x3 = x3.flatten()[:, None]
y1 = y1.flatten()[:, None]
y2 = y2.flatten()[:, None]
y3 = y3.flatten()[:, None]
t_probe = t_probe.flatten()[:, None]

_, _, p1 = model.predict(x1, y1, t_probe)
_, _, p2 = model.predict(x2, y2, t_probe)
_, _, p3 = model.predict(x3, y3, t_probe)
fig = plt.figure(figsize=(12,3))

ax1 = fig.add_subplot(1, 3, 1)
ax1.plot(t_probe, p1, c='b', label='P1(0.15,0.2)')
ax1.set_xlabel('Time(s)')
ax1.set_ylabel('Pressure(Pa)')
ax1.grid()
ax1.legend()

ax2 = fig.add_subplot(1, 3, 2)
ax2.plot(t_probe, p2, c='b', label='P2(0.2,0.25)')
ax2.set_xlabel('Time(s)')
ax2.set_ylabel('Pressure(Pa)')
ax2.grid()
ax2.legend()

ax3 = fig.add_subplot(1, 3, 3)
ax3.plot(t_probe, p3, c='b', label='P3(0.25,0.2)')
ax3.set_xlabel('Time(s)')
ax3.set_ylabel('Pressure(Pa)')
ax3.grid()
ax3.legend()

plt.tight_layout()
plt.show()
Define a function to output velocity and pressure fields to a file
# File output function

alpha = 1.0
cmap = 'rainbow'
marker= 'o'
s = 20

def make_aFrame(i, x, y, u, v, p):
    """
    i: frame number: 0-50
    x, y: 2d computational domain
    u, v, p: predicted u, v, p
    """
    fig = plt.figure(figsize=(12,14))
    ax1 = fig.add_subplot(3, 1, 1)
    cp = ax1.scatter(x, y, c=u, alpha=alpha, edgecolors='none', cmap=cmap, marker=marker, s=s)
    fig.colorbar(cp)
    ax1.set_xlim([0, 1.1])
    ax1.set_ylim([0, 0.41])
    ax1.set_title('u(m/s)')
    ax1.set_xlabel('x')
    ax1.set_ylabel('y')
    ax1.set_aspect('equal')

    ax2 = fig.add_subplot(3, 1, 2)
    cp = ax2.scatter(x, y, c=v, alpha=alpha, edgecolors='none', cmap=cmap, marker='o', s=s)
    fig.colorbar(cp)
    ax2.set_xlim([0, 1.1])
    ax2.set_ylim([0, 0.41])
    ax2.set_title('v(m/s)')
    ax2.set_xlabel('x')
    ax2.set_ylabel('y')
    ax2.set_aspect('equal')

    ax3 = fig.add_subplot(3, 1, 3)
    cp = ax3.scatter(x, y, c=p, alpha=alpha, edgecolors='none', cmap=cmap, marker='o', s=s)
    fig.colorbar(cp)
    ax3.set_xlim([0, 1.1])
    ax3.set_ylim([0, 0.41])
    ax3.set_title('Pressure(pa)')
    ax3.set_xlabel('x')
    ax3.set_ylabel('y')
    ax3.set_aspect('equal')

    plt.suptitle('Time: {:.02f}s'.format(i*0.01), fontsize=16)

    plt.tight_layout

    fig.savefig('./output/uvp{:03}.png'.format(i), dpi=100)
    plt.close(fig)
Obtain velocity and pressure fields in time steps (output to file using above function)
# Output u, v, p at each time step
Time_steps = 51
x_collo = np.linspace(0, 1.1, 401)
y_collo = np.linspace(0, 0.41, 161)
x_collo, y_collo = np.meshgrid(x_collo, y_collo)
x_collo = x_collo.flatten()[:, None]
y_collo = y_collo.flatten()[:, None]

# Remove cylinder internals
dst = ((x_collo - 0.2)**2 + (y_collo - 0.2)**2)**0.5
x_collo = x_collo[dst >= 0.05].flatten()[:, None]
y_collo = y_collo[dst >= 0.05].flatten()[:, None]

x_collo = x_collo.flatten()[:, None]
y_collo = y_collo.flatten()[:, None]

os.makedirs('./output')
# Time step loop
for i in range(Time_steps):
    t_collo = np.zeros((x_collo.size, 1))
    t_collo.fill(i*0.5/(Time_steps-1))
    u_pred, v_pred, p_pred = model.predict(x_collo, y_collo, t_collo)
    make_aFrame(i, x_collo, y_collo, u_pred, v_pred, p_pred)
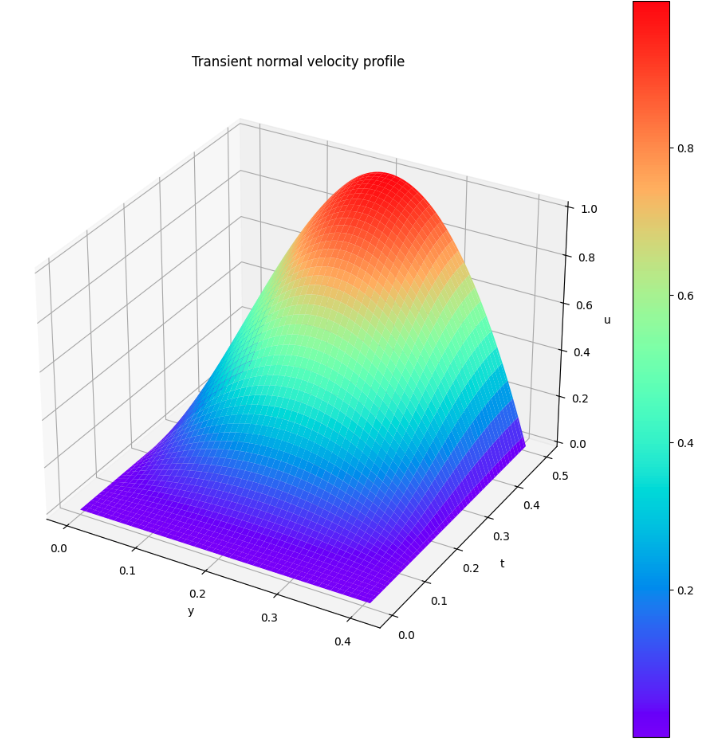
Visualization of flow velocity transition at the inlet
# Visualization of the velocity component(u) of INLET at time and y-coordinate
#y = INLET[:, 1:2]
#t = INLET[:, 2:3]
y = np.linspace(0, 0.41, 100)
t = np.linspace(0, 0.5, 100)
YY, TT = np.meshgrid(y, t)
U_max = 0.5
T = 1.0
#u_INLET = 4 * (np.sin(2*np.pi*t_INLET/T + 3*np.pi/2)+1.0) * U_max * y_INLET*(0.41-y_INLET)/(0.41**2)
Z = 4 * (np.sin(2*np.pi*TT/T + 3*np.pi/2)+1.0) * U_max * YY*(0.41-YY)/(0.41**2)

fig = plt.figure(figsize=(12, 12))
ax = fig.add_subplot(projection='3d')
surf = ax.plot_surface(YY, TT, Z, cmap='rainbow')
fig.colorbar(surf)
ax.set_xlabel('y')
ax.set_ylabel('t')
ax.set_zlabel('u')
ax.set_title("Transient normal velocity profile")
fig.show()
Visualization Results
Initial state (collocation points)

Loss curves

Pressure transition at the specific points

The pressures at all three sites are an order of magnitude smaller than in the paper. I have reviewed many things, but the cause is unknown.
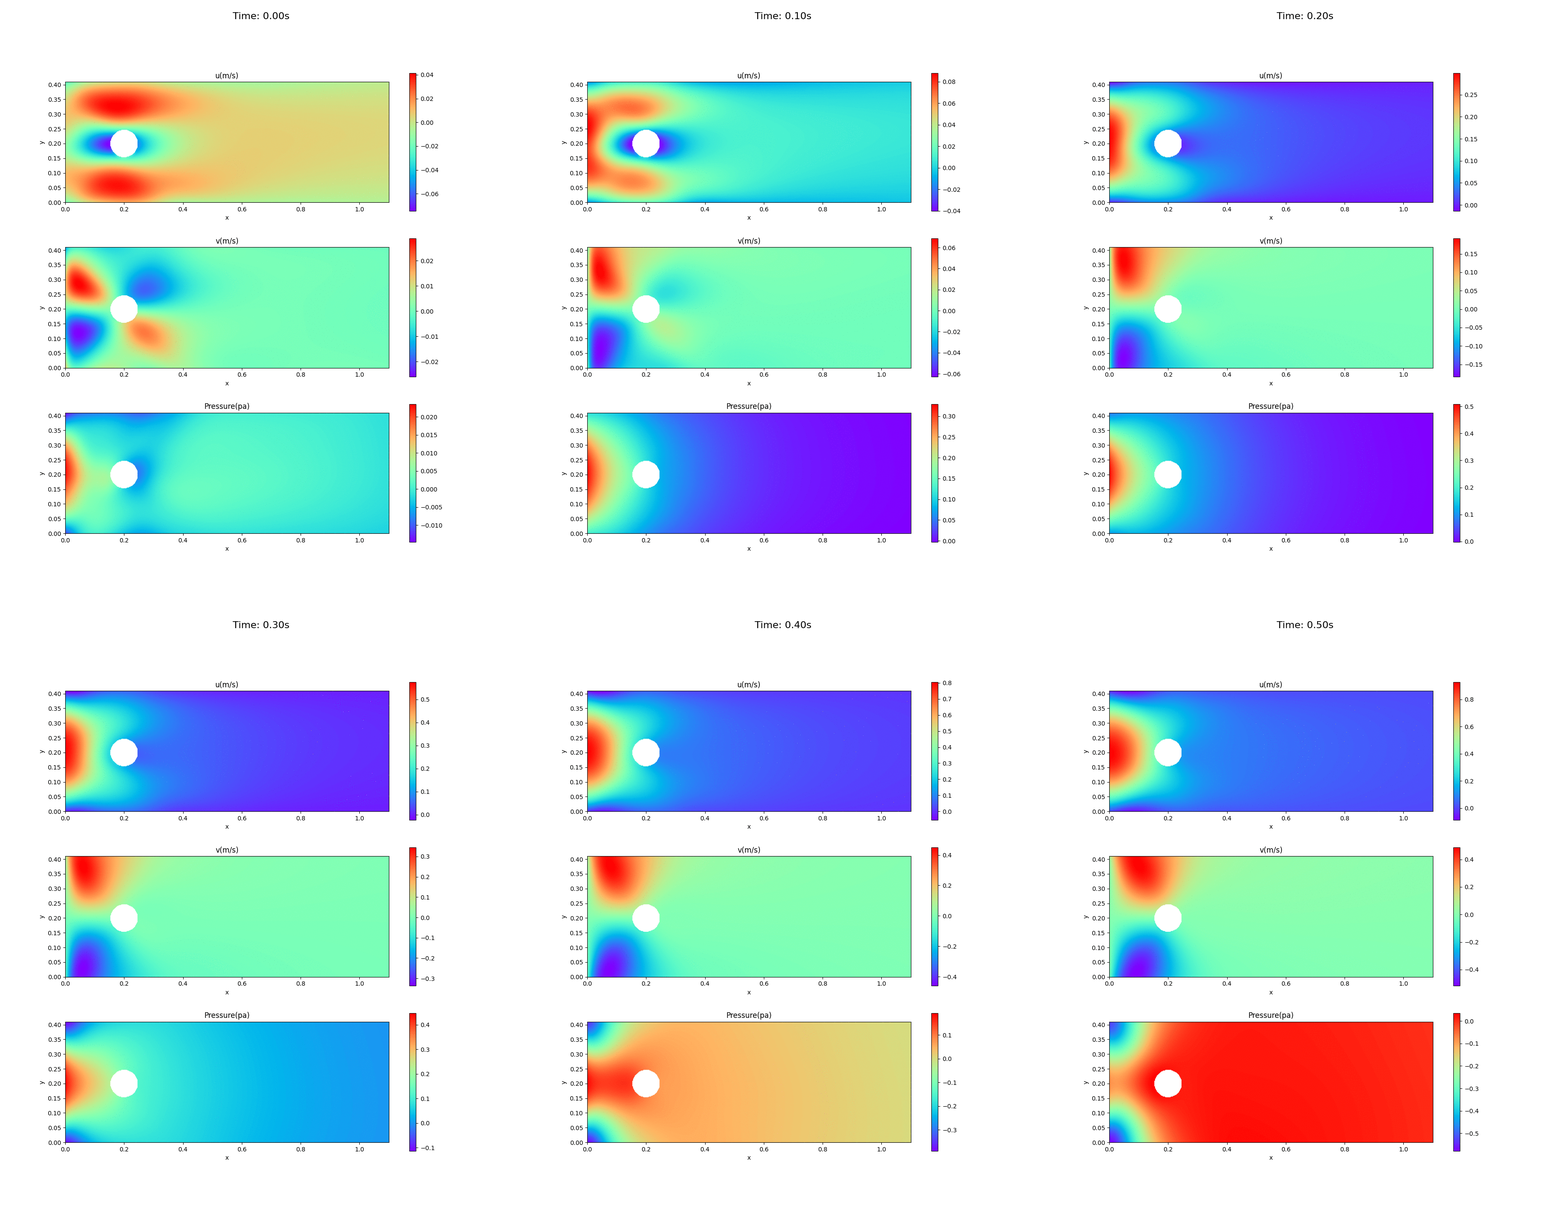
Animation of velocity and pressure fields
Animation of velocity and pressure fields from 0 to 0.5 sec. repeated 5 times. If the playback has stopped, redisplay the animation in your browser. The animation looks as if time is going backwards.

Velocity at inlet

From the above figure, the flow velocity in the x-direction at INLET appears to be fine.
Summary
Although I was reluctant to post results that were not correct, I summarized the results as they are at this point in time.
In the future, I would like to study Cauchy’s stress tensor, which I have avoided so far, and compare the results using that method. This may help me to understand the cause of this problem.