はじめに
先日、定常状態の層流についてPINNsで求められた内容を投稿した。今回は、非定常な層流についてPINNsの手法を適用した。今回の結果は、参考にした論文の結果とも異なり、正しい結果ではない。原因を調べているが、分かっていない。
情報源
- PINN-laminar-flow/PINN_unsteady - 前回の投稿で情報源1.として紹介したgithubの非定常版。Githubからも参照できるPhysics-informed deep learning for incompressible laminar flowsのデータを自分の結果を比べて、結果の妥当性を検討した。
物理的背景
支配方程式
先日投稿したPINNs - Steady-state Laminar Flowにおける支配方程式、すなわち連続とNS方程式である式(3)(4)は、外圧の無い2次元の非圧縮流体であるから、次のようになる。(式の番号は、前回と同じにしている) $$ \nabla \cdot \boldsymbol{v} = 0 \tag{3} $$
$$ \rho \left(\frac{\partial \boldsymbol{v}}{\partial t} + (\boldsymbol{v}\cdot \nabla)\boldsymbol{v} \right) +\nabla p - \mu \Delta \boldsymbol{v} = 0\tag{4} $$
上記の式(3)(4)を2次元の座標$(x, y)$、速度成分$(u,v)$を使って表すと次のとおり。 $$ \frac{\partial u}{\partial x} + \frac{\partial v}{\partial y} = 0 \tag{5} $$
$$ \frac{\partial p}{\partial x} - \mu \left(\frac{\partial^2 u}{\partial x^2}+\frac{\partial^2 u}{\partial y^2}\right) + \rho \left( \frac{\partial u}{\partial t} + u\frac{\partial u}{\partial x}+v\frac{\partial u}{\partial y}\right) = 0 \tag{6} $$
$$ \frac{\partial p}{\partial y} - \mu \left(\frac{\partial^2 v}{\partial x^2}+\frac{\partial^2 v}{\partial y^2}\right) + \rho \left( \frac{\partial v}{\partial t}+u\frac{\partial v}{\partial x}+v\frac{\partial v}{\partial y}\right) = 0 \tag{7} $$
すなわち、上式が今回の支配方程式である。コーディングにおいては、上記をそれぞれf1、 f2、 f3としている。
コード
パッケージをimport
import os
import numpy as np

import torch
import torch.nn as nn
import torch.nn.functional as F
from torch import optim
from torch.optim import lr_scheduler

import matplotlib.pyplot as plt

from pyDOE import lhs  # Latin Hypercube Sampling (LHS)

# run on cuda if possible
device = 'cuda' if torch.cuda.is_available() else 'cpu'
print("Running on", device)
関数を定義
# Remove points inside the cylinder from collocation points
#  Find the distance between the center of the cylinder (xc, yc) and a point,
#  and delete anything less than the cylinder radius (r).
def Remove_inCylinder(coor, xc, yc, r):
    distance = np.array([((xy[0] - xc)**2 + (xy[1]-yc)**2)**0.5 for xy in coor])
    return coor[distance > r, :]
問題領域(変数、定数)を定義
# Define variables to represent computation domains

# Some constants
IC_samples = 10000  # 4000→10000
wall_samples = 6000  # y=0,0.41 are meaningless, so increase the number of samples
cylinder_samples = 4000
inlet_samples = 6000  # x=0 is meaningless, so increase the number of samples
outlet_samples = 3000

# Domain bounds
xmin = 0.0
ymin = 0.0
tmin = 0.0
xmax = 1.1
ymax = 0.41
tmax = 0.5
lb = np.array([xmin, ymin, tmin])
ub = np.array([xmax, ymax, tmax])

# Inital Condition:
#  (u, v, p) = (0, 0, 0) at t= 0, x ∈ [0, 1.1], y ∈ [0, 0.41]

xy_IC = [0.0, 0.0] + [1.1, 0.41] * lhs(2, IC_samples)
t_IC = np.zeros((IC_samples, 1))
IC = np.concatenate((xy_IC, t_IC), 1)
IC = Remove_inCylinder(IC, xc=0.2, yc=0.2, r=0.05)

# define floor, ceiling
#   celling(x,y,t): (0, 0.41 ,0)-(1.1, 0.41, 0.5)
#   floor(x,y,t): (0, 0, 0)-(1.1, 0, 0.5)
CEILING = [0.0, 0.41, 0.0] + [1.1, 0.0, 0.5] * lhs(3, wall_samples)
FLOOR = [0.0, 0.0, 0.0] + [1.1, 0.0, 0.5] * lhs(3, wall_samples)

# Define cylinder surface
rt_CYLD = [0.0, 0.0] + [2*np.pi, 0.5] * lhs(2, cylinder_samples)
x_CYLD = np.multiply(0.05, np.cos(rt_CYLD[:, 0:1])) + 0.2
y_CYLD = np.multiply(0.05, np.sin(rt_CYLD[:, 0:1])) + 0.2
HOLE = np.concatenate((x_CYLD, y_CYLD, rt_CYLD[:, 1:2]), 1)

# define wall(floor, ceiling, hole)
WALL = np.concatenate((HOLE, CEILING, FLOOR), 0)

# Define INLET
U_max = 0.5
T = 0.5*2

xyt_INLET = [0.0, 0.0, 0.0] + [0.0, 0.41, 0.5] * lhs(3, inlet_samples)
x_INLET = xyt_INLET[:, 0:1]
y_INLET = xyt_INLET[:, 1:2]
t_INLET = xyt_INLET[:, 2:3]
u_INLET = 4 * (np.sin(2*np.pi*t_INLET/T + 3*np.pi/2)+1.0) * U_max * y_INLET*(0.41-y_INLET)/(0.41**2)
v_INLET = np.zeros_like(u_INLET)
INLET = np.concatenate((x_INLET, y_INLET, t_INLET, u_INLET, v_INLET), 1)

# Define OUTLET
OUTLET = [1.1, 0.0, 0.0] + [0.0, 0.41, 0.5] * lhs(3, outlet_samples)

# Define Collocation points, with refinement near the wall
collo_samples = 60000
refine_samples = 10000
near_samples = 2000

xyt_Collo = lb + (ub - lb) * lhs(3, collo_samples)
xyt_refine = [0.0, 0.0, 0.0] + [0.4, 0.4, tmax] * lhs(3, refine_samples)
xyt_floor = [0.0, 0.0, 0.0] + [1.1, 0.02, tmax] * lhs(3, near_samples)
xyt_ceiling = [0.0, 0.39, 0.0] + [1.1, 0.02, tmax] * lhs(3, near_samples)
Collo = np.concatenate((xyt_Collo, xyt_refine, xyt_floor, xyt_ceiling), 0)
Collo = Remove_inCylinder(Collo, xc=0.2, yc=0.2, r=0.05)
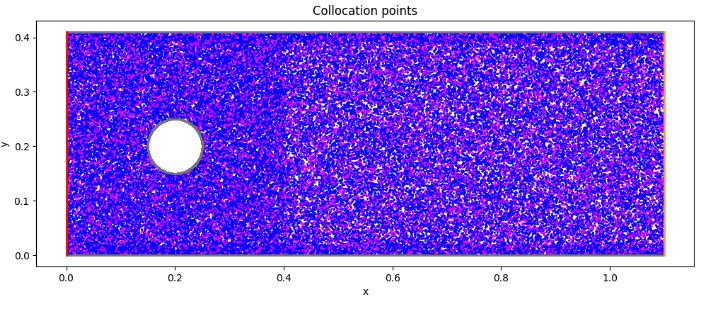
collocation pointを可視化
# Visualize the collocation points
fig, ax = plt.subplots(figsize=(12,8))
ax.set_aspect('equal')
ax.scatter(Collo[:, 0:1], Collo[:, 1:2], marker='o', color='blue', s=1)
ax.scatter(IC[:, 0:1], IC[:, 1:2], marker='o', color='magenta', s=1)
ax.scatter(WALL[:, 0:1], WALL[:, 1:2], marker='o', color= 'gray', s=1)
ax.scatter(OUTLET[:, 0:1], OUTLET[:, 1:2], marker='o', color='orange', s=1)
ax.scatter(INLET[:, 0:1], INLET[:, 1:2], marker='o', color='red', s=1)
ax.set_title('Collocation points')
ax.set_xlabel('x')
ax.set_ylabel('y')
plt.show()
学習に使う変数をtensor化
# Define collocation, INLET, OUTLET, and WALL variables as torch.tensor
x_c = torch.tensor(Collo[:, 0:1], device=device, dtype=torch.float32)
y_c = torch.tensor(Collo[:, 1:2], device=device, dtype=torch.float32)
t_c = torch.tensor(Collo[:, 2:3], device=device, dtype=torch.float32)

x_IC = torch.tensor(IC[:, 0:1], device=device, dtype=torch.float32)
y_IC = torch.tensor(IC[:, 1:2], device=device, dtype=torch.float32)
t_IC = torch.tensor(IC[:, 2:3], device=device, dtype=torch.float32)

x_INLET = torch.tensor(INLET[:, 0:1], device=device, dtype=torch.float32)
y_INLET = torch.tensor(INLET[:, 1:2], device=device, dtype=torch.float32)
t_INLET = torch.tensor(INLET[:, 2:3], device=device, dtype=torch.float32)
u_INLET = torch.tensor(INLET[:, 3:4], device=device, dtype=torch.float32)
v_INLET = torch.tensor(INLET[:, 4:5], device=device, dtype=torch.float32)

x_OUTLET = torch.tensor(OUTLET[:, 0:1], device=device, dtype=torch.float32)
y_OUTLET = torch.tensor(OUTLET[:, 1:2], device=device, dtype=torch.float32)
t_OUTLET = torch.tensor(OUTLET[:, 2:3], device=device, dtype=torch.float32)


x_WALL = torch.tensor(WALL[:, 0:1], device=device, dtype=torch.float32)
y_WALL = torch.tensor(WALL[:, 1:2], device=device, dtype=torch.float32)
t_WALL = torch.tensor(WALL[:, 2:3], device=device, dtype=torch.float32)

mu = 0.005
rho = 1.0
全結合層のネットワーククラスを作成
# define p_NN class

class p_NN(nn.Module):
    def __init__(self, n_input, n_output, n_hiddens=[32,64,128,128,64,32]):
        super().__init__()
        self.activation = nn.Tanh()
        self.input_layer = nn.Linear(n_input, n_hiddens[0])
        self.hidden_layers = nn.ModuleList(
            [nn.Linear(n_hiddens[i], n_hiddens[i+1]) for i in range(len(n_hiddens)-1)]
        )
        self.output_layer = nn.Linear(n_hiddens[-1], n_output)

    def forward(self, x):
        x = self.activation(self.input_layer(x))
        for layer in self.hidden_layers:
            x = self.activation(layer(x))
        x = self.output_layer(x)
        return x

    def neural_net(self, x, y, t):
        inputs = torch.cat([x, y, t], dim=1)
        outputs = self.forward(inputs)
        u = outputs[:, 0:1]
        v = outputs[:, 1:2]
        p = outputs[:, 2:3]
        return u, v, p

    def net_f(self, x, y, t):
        x.requires_grad = True
        y.requires_grad = True
        t.requires_grad = True
        u, v, p = self.neural_net(x, y, t)
        u_x = gradients(u, x)
        v_y = gradients(v, y)
        f1 = u_x + v_y

        p_x = gradients(p, x)
        u_y = gradients(u, y)
        u_t = gradients(u, t)
        u_xx = gradients(u_x, x)
        u_yy = gradients(u_y, y)
        f2 = p_x - mu*(u_xx + u_yy) + rho*(u_t + u*u_x + v*u_y)

        p_y = gradients(p, y)
        v_x = gradients(v, x)
        v_t = gradients(v, t)
        v_xx = gradients(v_x, x)
        v_yy = gradients(v_y, y)
        f3 = p_y - mu*(v_xx + v_yy) + rho*(v_t + u*v_x + v*v_y)

        return f1, f2, f3

    def predict(self, x, y, t):  # no tensor is passed, return no tensor
      xx = torch.tensor(x, device=device, dtype=torch.float32)
        yy = torch.tensor(y, device=device, dtype=torch.float32)
        tt = torch.tensor(t, device=device, dtype=torch.float32)
        uu, vv, pp = self.neural_net(xx, yy, tt)
        u = uu.to("cpu").detach().numpy()
        v = vv.to("cpu").detach().numpy()
        p = pp.to("cpu").detach().numpy()

        return u, v, p
微分関数を定義
# Differentiation by pytorch
# return dy/dx
def gradients(y, x):
    return torch.autograd.grad(y,
                               x,
                               grad_outputs=torch.ones_like(y),
                               create_graph=True,
                              )[0]
モデルを作成(インスタンス化)
# Create a Model
#  Input: (x, y)
#  Output: (u, v, p)
model = p_NN(3, 3).to(device)
print(model)
損失関数、最適化関数を定義
# Loss function: Mean Square Error
loss_func = nn.MSELoss()

# Optimizer: Adam(Adaptive moment estimation)
optimizer = optim.Adam(model.parameters(), lr=0.001)

# scheduler = lr_scheduler.ExponentialLR(optimizer, gamma=0.98)
前回同様、loss_func()は使っていない。
学習ループ
# learning Loop

num_epoch = 5000  # epoch count

Epoch = []
Loss_f1 = []
Loss_f2 = []
Loss_f3 = []
Loss_PINN = []
Loss_TOTAL = []
Loss_IC = []
Loss_WALL = []
Loss_INLET = []
Loss_OUTLET = []

for i in range(num_epoch):
    if i == 0:
        print("Epoch \t Loss_Total \t Loss_PINN \t Loss_IC \t Loss_WALL \t Loss_INLET \t Loss_OUTLET")

    optimizer.zero_grad()
    f1, f2, f3 = model.net_f(x_c, y_c, t_c)
    loss_f1 = torch.mean(f1**2)
    loss_f2 = torch.mean(f2**2)
    loss_f3 = torch.mean(f3**2)
    loss_PINN = loss_f1 + loss_f2 + loss_f3

    u_ic, v_ic, p_ic = model.neural_net(x_IC, y_IC, t_IC)
    loss_IC = torch.mean(u_ic**2) + torch.mean(v_ic**2) + torch.mean(p_ic**2)

    u_wall, v_wall, _ = model.neural_net(x_WALL, y_WALL, t_WALL)
    loss_WALL = torch.mean(u_wall**2) + torch.mean(v_wall**2)

    u_inlet, v_inlet, _ = model.neural_net(x_INLET, y_INLET, t_INLET)
    loss_INLET = torch.mean((u_inlet - u_INLET)**2) + torch.mean(v_inlet**2)

    _, _, p_outlet = model.neural_net(x_OUTLET, y_OUTLET, t_OUTLET)
    loss_OUTLET = torch.mean(p_outlet**2)

    loss_TOTAL = loss_PINN + 2*(loss_IC + loss_WALL + loss_INLET + loss_OUTLET)

    loss_TOTAL.backward()
    optimizer.step()

    if i % 100 == 0:
        Epoch.append(i)
        Loss_f1.append(loss_f1.detach().cpu().numpy())
        Loss_f2.append(loss_f2.detach().cpu().numpy())
        Loss_f3.append(loss_f3.detach().cpu().numpy())
        Loss_PINN.append(loss_PINN.detach().cpu().numpy())
        Loss_TOTAL.append(loss_TOTAL.detach().cpu().numpy())
        Loss_IC.append(loss_IC.detach().cpu().numpy())
        Loss_WALL.append(loss_WALL.detach().cpu().numpy())
        Loss_INLET.append(loss_INLET.detach().cpu().numpy())
        Loss_OUTLET.append(loss_OUTLET.detach().cpu().numpy())

    if i % 1000 == 0:
        print(i, "\t",
              format(loss_TOTAL.detach().cpu().numpy(), ".4E"), "\t",
              format(loss_PINN.detach().cpu().numpy(), ".4E"), "\t",
              format(loss_IC.detach().cpu().numpy(), ".4E"), "\t",
              format(loss_WALL.detach().cpu().numpy(), ".4E"), "\t",
              format(loss_INLET.detach().cpu().numpy(), ".4E"), "\t",
              format(loss_OUTLET.detach().cpu().numpy(), ".4E"), "\t",
             )
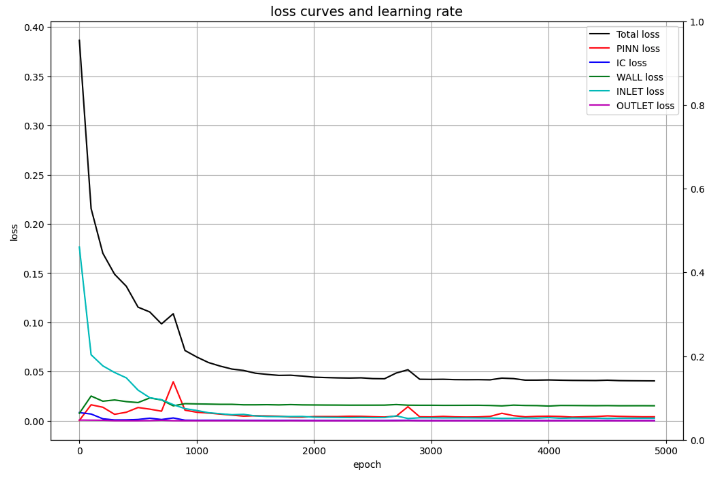
損失を可視化
# Draw loss curves

fig, ax1 = plt.subplots(figsize=(12, 8))
ax2 = ax1.twinx()

ax1.plot(Epoch, Loss_TOTAL, c='black', label='Total loss')
ax1.plot(Epoch, Loss_PINN, c='red', label='PINN loss')
ax1.plot(Epoch, Loss_IC, c='b', label='IC loss')
ax1.plot(Epoch, Loss_WALL, c='g', label='WALL loss')
ax1.plot(Epoch, Loss_INLET, c='c', label='INLET loss')
ax1.plot(Epoch, Loss_OUTLET, c='m', label='OUTLET loss')
ax1.set_xlabel('epoch')
ax1.set_ylabel('loss')
ax1.set_title('loss curves and learning rate', fontsize='14')
ax1.grid()
ax1.legend()

plt.show()
特定の点での圧力の時間推移を可視化
論文と同じ結果が得られたかを確認するため、論文に掲載されている3点の圧力について時間推移を可視化する。
# Predict the time evolution of pressure
# at the pressure measurement point (virtual pressure probe)
t_probe = np.linspace(0, 0.5, 100)
x1 = np.zeros_like(t_probe)
x2 = np.zeros_like(t_probe)
x3 = np.zeros_like(t_probe)
x1.fill(0.15)
x2.fill(0.20)
x3.fill(0.25)
y1 = np.zeros_like(t_probe)
y2 = np.zeros_like(t_probe)
y3 = np.zeros_like(t_probe)
y1.fill(0.20)
y2.fill(0.25)
y3.fill(0.20)
x1 = x1.flatten()[:, None]
x2 = x2.flatten()[:, None]
x3 = x3.flatten()[:, None]
y1 = y1.flatten()[:, None]
y2 = y2.flatten()[:, None]
y3 = y3.flatten()[:, None]
t_probe = t_probe.flatten()[:, None]

_, _, p1 = model.predict(x1, y1, t_probe)
_, _, p2 = model.predict(x2, y2, t_probe)
_, _, p3 = model.predict(x3, y3, t_probe)
fig = plt.figure(figsize=(12,3))

ax1 = fig.add_subplot(1, 3, 1)
ax1.plot(t_probe, p1, c='b', label='P1(0.15,0.2)')
ax1.set_xlabel('Time(s)')
ax1.set_ylabel('Pressure(Pa)')
ax1.grid()
ax1.legend()

ax2 = fig.add_subplot(1, 3, 2)
ax2.plot(t_probe, p2, c='b', label='P2(0.2,0.25)')
ax2.set_xlabel('Time(s)')
ax2.set_ylabel('Pressure(Pa)')
ax2.grid()
ax2.legend()

ax3 = fig.add_subplot(1, 3, 3)
ax3.plot(t_probe, p3, c='b', label='P3(0.25,0.2)')
ax3.set_xlabel('Time(s)')
ax3.set_ylabel('Pressure(Pa)')
ax3.grid()
ax3.legend()

plt.tight_layout()
plt.show()
速度場、圧力場をファイル出力する関数を定義
# File output function

alpha = 1.0
cmap = 'rainbow'
marker= 'o'
s = 20

def make_aFrame(i, x, y, u, v, p):
    """
    i: frame number: 0-50
    x, y: 2d computational domain
    u, v, p: predicted u, v, p
    """
    fig = plt.figure(figsize=(12,14))
    ax1 = fig.add_subplot(3, 1, 1)
    cp = ax1.scatter(x, y, c=u, alpha=alpha, edgecolors='none', cmap=cmap, marker=marker, s=s)
    fig.colorbar(cp)
    ax1.set_xlim([0, 1.1])
    ax1.set_ylim([0, 0.41])
    ax1.set_title('u(m/s)')
    ax1.set_xlabel('x')
    ax1.set_ylabel('y')
    ax1.set_aspect('equal')

    ax2 = fig.add_subplot(3, 1, 2)
    cp = ax2.scatter(x, y, c=v, alpha=alpha, edgecolors='none', cmap=cmap, marker='o', s=s)
    fig.colorbar(cp)
    ax2.set_xlim([0, 1.1])
    ax2.set_ylim([0, 0.41])
    ax2.set_title('v(m/s)')
    ax2.set_xlabel('x')
    ax2.set_ylabel('y')
    ax2.set_aspect('equal')

    ax3 = fig.add_subplot(3, 1, 3)
    cp = ax3.scatter(x, y, c=p, alpha=alpha, edgecolors='none', cmap=cmap, marker='o', s=s)
    fig.colorbar(cp)
    ax3.set_xlim([0, 1.1])
    ax3.set_ylim([0, 0.41])
    ax3.set_title('Pressure(pa)')
    ax3.set_xlabel('x')
    ax3.set_ylabel('y')
    ax3.set_aspect('equal')

    plt.suptitle('Time: {:.02f}s'.format(i*0.01), fontsize=16)

    plt.tight_layout

    fig.savefig('./output/uvp{:03}.png'.format(i), dpi=100)
    plt.close(fig)
時間刻みで速度場、圧力場を求める(上記関数でファイル出力)
# Output u, v, p at each time step
Time_steps = 51
x_collo = np.linspace(0, 1.1, 401)
y_collo = np.linspace(0, 0.41, 161)
x_collo, y_collo = np.meshgrid(x_collo, y_collo)
x_collo = x_collo.flatten()[:, None]
y_collo = y_collo.flatten()[:, None]

# Remove cylinder internals
dst = ((x_collo - 0.2)**2 + (y_collo - 0.2)**2)**0.5
x_collo = x_collo[dst >= 0.05].flatten()[:, None]
y_collo = y_collo[dst >= 0.05].flatten()[:, None]

x_collo = x_collo.flatten()[:, None]
y_collo = y_collo.flatten()[:, None]

os.makedirs('./output')
# Time step loop
for i in range(Time_steps):
    t_collo = np.zeros((x_collo.size, 1))
    t_collo.fill(i*0.5/(Time_steps-1))
    u_pred, v_pred, p_pred = model.predict(x_collo, y_collo, t_collo)
    make_aFrame(i, x_collo, y_collo, u_pred, v_pred, p_pred)
流入口での流速の推移を可視化
# Visualization of the velocity component(u) of INLET at time and y-coordinate
#y = INLET[:, 1:2]
#t = INLET[:, 2:3]
y = np.linspace(0, 0.41, 100)
t = np.linspace(0, 0.5, 100)
YY, TT = np.meshgrid(y, t)
U_max = 0.5
T = 1.0
#u_INLET = 4 * (np.sin(2*np.pi*t_INLET/T + 3*np.pi/2)+1.0) * U_max * y_INLET*(0.41-y_INLET)/(0.41**2)
Z = 4 * (np.sin(2*np.pi*TT/T + 3*np.pi/2)+1.0) * U_max * YY*(0.41-YY)/(0.41**2)

fig = plt.figure(figsize=(12, 12))
ax = fig.add_subplot(projection='3d')
surf = ax.plot_surface(YY, TT, Z, cmap='rainbow')
fig.colorbar(surf)
ax.set_xlabel('y')
ax.set_ylabel('t')
ax.set_zlabel('u')
ax.set_title("Transient normal velocity profile")
fig.show()
可視化結果
初期状態(collocation points)

学習状況

特定地点の圧力推移

3地点とも論文と比べると、圧力が1桁小さい。色々見直したが、原因不明である。
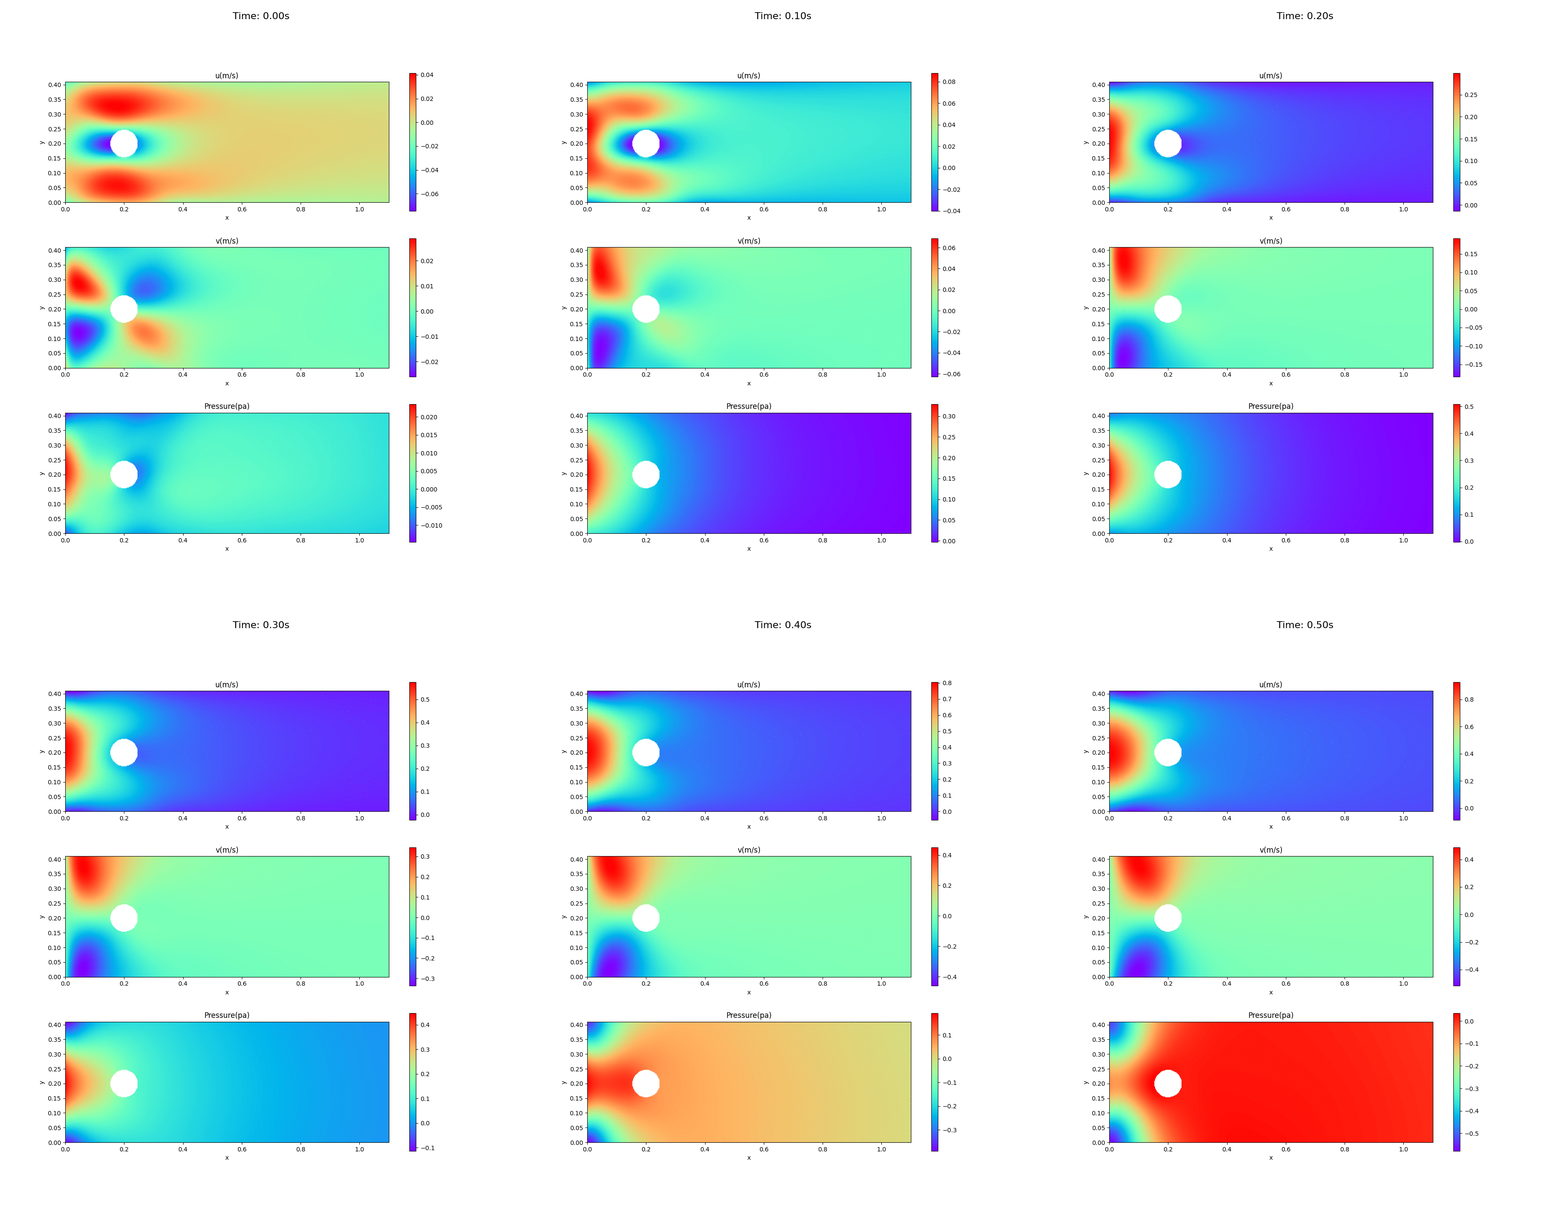
速度場、圧力場のアニメーション
0〜0.5秒までの速度場と圧力場のアニメーション。5回繰り返す。再生が止まっていたら、ブラウザで再表示を。見た感じ時間が逆に戻っているようなアニメーションである。

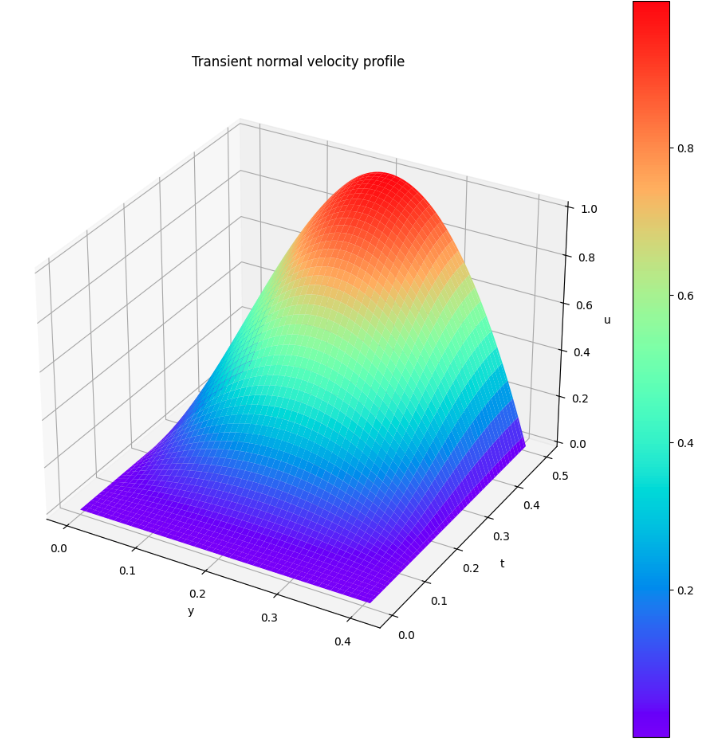
流入口での速度の推移

上記の図からは、INLETでのx方向の流速は問題なさそうである。
まとめ
正しい結果でないのを投稿することに抵抗はあったが、現時点の結果ということで、まとめた。
今後、これまで避けていたCauchyのstress tensorを勉強して、そちらのやり方で実施して結果を比べたい。そうすることで、今回の問題の原因も分かるかもしれない。